Using Predictive Analytics for Caseload Prioritization at Randolph Community College
At a glance
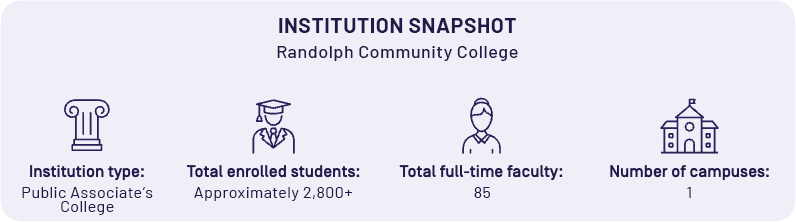
Randolph Community College
“These risk factors actually drive the intervention. For example, the student may have a low GPA. We may work on forecasting how to obtain a higher GPA. There may be particular test scores that we need to look at and figure out interventions to elevate those. Maybe they failed a particular course a number of times or have struggled in online courses … We do a deep dive into all the risk factors that occur with a particular student and then formulate interventions to allow them to be successful.”
Pamela Wiggins
Success Coach – Randolph Community College
Learn more about how Randolph Community College uses predictive analytics from Watermark to support caseload prioritization and intervention.
Download Now

Within Watermark’s Student Success & Engagement, students are assigned into low, medium and high risk groups based on historical and current institutional data. Student Success & Engagement identifies the students where institutions can make the greatest impact, right now, by providing data points and information to staff and faculty to help guide their conversations and provide intervention opportunities to help students succeed.
Key data that exists in various systems is turned into actionable insights and combined with risk-based predictive models, all to prioritize the engagement and intervention strategies used to help the students succeed.
Predictive analytics can help your institution proactively address the academic and personal needs of students. Access to risk indicators in combination with staff-initiated and automated early alerts results in more targeted student outreach.
Staff and faculty at Randolph are able to easily personalize their outreach, plan their intervention strategies and quickly identify the student’s risk, allowing for a more proactive approach to student success. Success Coaches use Student Success & Engagement’s risk scores to prioritize their workflow and provide the right intervention at the right time. Specific risk factors align with specific intervention strategies.
Outreach Prioritization
- Address staff-initiated alerts first to address issues that colleagues have noticed and logged. Providing insight is imperative to increase the likelihood of a student’s success.
- Address automated alerts based on predictive analytic risk levels. For the greatest return on investment of time and resources, focus outreach on medium-risk (yellow) students first, then high-risk (red), and then low-risk (green) to get measurable results.
Risk Factor Analysis
- Look for common predictors that drive interventions, such as low GPA, low test scores or failing a course in a previous semester.
- These risk factors then drive research into the student’s record.
- When armed with this information, coaches can have deeper conversations with students.
Predictive Face-to-Face Outreach
- Don’t rely on simple email or text outreach. Instead, roam the campus and wait outside of students’ classes to chat. Have Student Success & Engagement up on your mobile device to track down students and log interactions.
- Research shows that out-of-office interactions increase impact.
- These interactions also help success coaches do a motivational analysis to find out what drives each student and log those in the notes section.
In December of 2021, Watermark Insights acquired Aviso Retention. Student Success & Engagement includes all former Aviso products.
Student Success & Engagement gathers institutional data to identify predictive factors such as Geo-Demographics, Academic Ability, Academic Performance, Academic Scheduling, Course Sequencing, Ability to Pay, and Financial Support. The solution deploys pre-built integrations and connectors for the most commonly used Learning Management and Student Information Systems in higher ed. Student Success & Engagement then accurately measures and determines why students may be successful and, most importantly, at risk of completing their course work and persisting to the next term.
Using this data, we can create three types of predictive models:
- Course Completion model: Probability the student will complete the course
- Term Persistence model: Probability that the student will return the following term
- Certificate Completion model: Probability that the student will complete a certificate or degree


Browse our resource library
See how our tools are helping clients right now, get in-depth information on topics that matter, and stay up-to-date on trends in higher ed.