Infographic
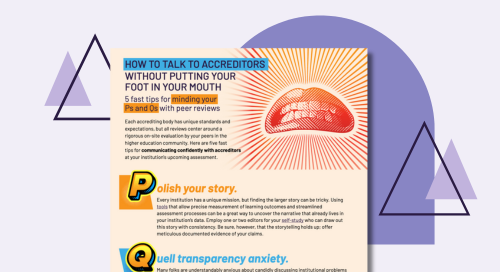
How to talk to accreditors without putting your foot in your mouth
Accrediting bodies have rigorous on-site evaluations, but you shouldn't panic. Here are five fast tips for communicating confidently with accreditors...
Read Now →