Understanding the links between faculty performance and student outcomes is integral to the overall success of your higher education institution. Schools need the right tools to monitor the institutional insights required to enhance transparency, accountability and quality assurance regarding their academic programs.
At Radford University, the road to uncovering the role of faculty influence on student success began by shifting annual faculty reviews from a paper system to a digital format.
Today, Radford’s faculty activity database helps administrative users make informed decisions and measure how faculty contributes to student success as well as other strategic priorities. Let’s dive into how they did it.
About Radford University
Founded by the Virginia General Assembly in 1910 as the State Normal and Industrial School for Women, Radford University has grown well beyond its original mission to educate women as teachers.
Today, the university serves more than 7,700 students with a diverse array of undergraduate, graduate, and doctoral degree programs. Radford’s approximately 500 full-time faculty emphasize the importance of education to the development of mature, responsible, well-rounded citizens.
Background
Prior to implementing the digital database, Radford tracked faculty activities on paper.
“We collected the paper annual reports, pulled the staples out and ran them through a PDF scanner, and those scans went into the big digital archive of electronic files. But it wasn’t a usable form of data,” said Charley Cosmato, Director of the Center for Innovative Teaching and Learning at Radford. “Somebody would have to go through and read line by line.”
Adopting a faculty activity reporting (FAR) solution enabled Radford to implement annual reviews and Association to Advance Collegiate Schools of Business (AACSB) accreditation reporting. The university then pivoted to considering how faculty activity data could answer larger institutional questions, including showing faculty influence on student success.
Think bigger: what information do you need?
“To provide reporting that’s strategically relevant to the university, you need the 30,000-foot view,” said Andrew Wiech, Senior Engagement Consultant for Watermark Faculty Success. “It’s important to ask, ‘What would allow you to make your decisions more confidently or answer your questions more accurately? If we put this information in front of you, what should it look like?’”
By reverse-engineering your college or university’s approach, you can save extensive time, money, and energy required to comb through, identify patterns, and make sense of your institutional data. Identifying which questions to answer allowed Wiech and Cosmato to define what data they needed. Then, they used those insights to produce reports that would answer those questions and inform administrative decisions.
Wiech noted that it’s important for institutions to consider how they can use their existing data to reveal the big picture and tell a university-wide story. These insights include:
- Student feedback.
- Grades.
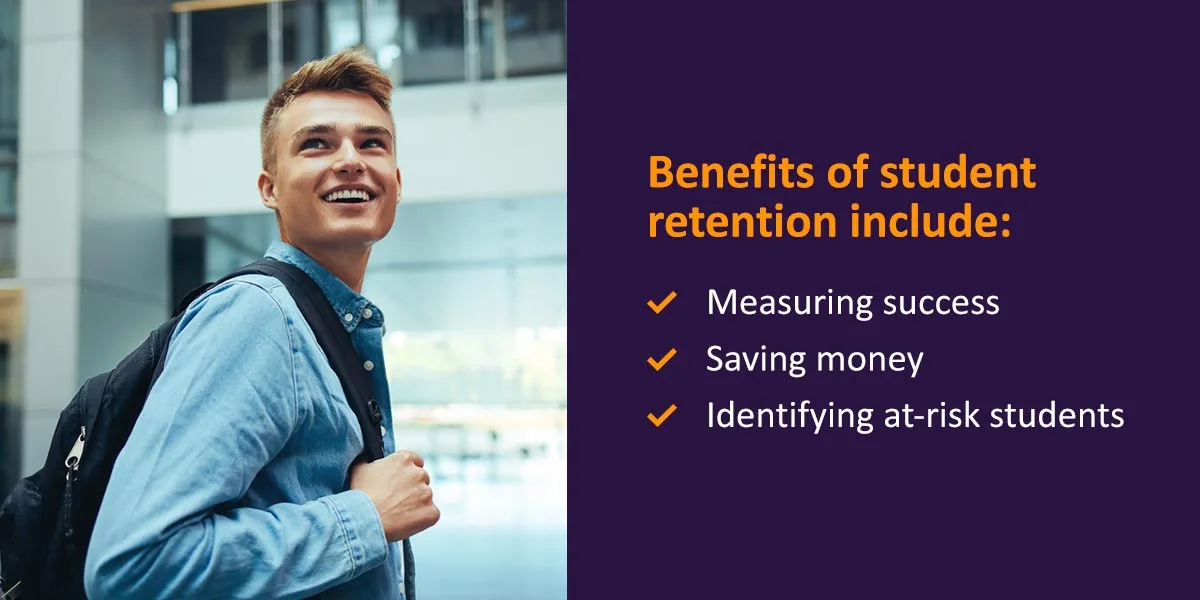
- Retention and graduation rates.
- Standardized test scores.
- Programmatic assessments.
- Teaching portfolios.
- Professional development records.
- Faculty research.
- Learning management system data.
- Student advising records.
- Peer evaluations.
“The question isn’t, ‘What can my data tell me?’ But, ‘What do I need to know?’ Don’t let the data wag the dog,” Wiech explained.
Data makes it easier for your institution to identify the parallels and correlations between faculty and student performance to make strategic decisions that support continuous improvement at every level.
Radford and student success
Student success is a key component in Radford’s strategic plan, and FAR is essential for understanding how students are doing. According to Cosmato, faculty activity is a key indicator of student success predictors such as experiential learning, service learning, and high-impact practices (HIPs).
Upon implementation of their digital FAR solution, the project team realized they could query the faculty activity dataset to determine whether their initiatives were truly making a difference. By leveraging a highly configurable solution equipped with various out-of-the-box reporting features, Radford was able to access the insights they needed and effectively communicate their findings.
With input from many campus stakeholders, Radford determined that to increase retention and graduation rates, the university should:
- Remove barriers.
- Elevate the in-class experience.
- Foster effective, timely advising.
- Keep communications clear.
- Address each student’s unique needs.
The university then identified a list of faculty activities that could serve as key performance indicators for improving the classroom experience, such as:
- Providing continued support for HIPs.
- Supporting and celebrating faculty members devoted to student success.
- Facilitating in-classroom student support.
- Fortunately, the database was already capturing many related faculty activities for annual reviews, including:
- Innovation in the classroom.
- Publications.
- Performances.
- Presentations.
- Dissertation supervision.
- Academic advising.
- Grants.
By clarifying Radford’s questions and carefully describing the needed output, Wiech and Cosmato were able to adjust data content and structure to ensure the information faculty entered could be used to answer those questions.
“This [capability] made the transition from a tactical view to a strategic view easier to accomplish,” Wiech said.
Shifting from tactical to strategic and back
Your higher education institution will benefit from understanding how to transition between tactical and strategic approaches to your data effectively. Learn more about each approach below:
- Tactical view: In a tactical approach, your faculty might focus on student interactions, course materials, and specific teaching methods to assess current learning outcomes. They may measure short-term metrics like grades, satisfaction surveys, or class attendance rates. This view usually involves addressing immediate student needs to foster success.
- Strategic view: This approach concentrates on the broader context of student success. It involves aligning teaching methods with long-term objectives and learning outcomes. Key metrics to measure include graduation rates, retention rates, and career outcomes. The strategic view takes into account how curriculum development, mentorship, and advising programs, research, and assessment design can support student success.
Balancing and shifting between both views requires:
- Flexibility: Your faculty members must be flexible in transitioning between strategic and tactical approaches because the needs of your institution and students are always evolving.
- Integration: By integrating tactical and strategic frameworks, your faculty members can ensure their daily activities are positively contributing to your institution’s long-term goals relating to student success.
- Reflection: One of the best ways to foster greater learning outcomes at your higher education institution is through constant assessment and continuous improvement efforts. Encourage your educators to reflect on their teaching practices and gauge their effectiveness to support student goals.
Transitioning back and forth from a tactical to a strategic approach allows your institution to balance both its short- and long-term goals. Using data from the following sources, Radford could directly trace student outcomes back to best practices, such as:
- Innovative teaching practices.
- HIPs such as internships and capstone projects.
- Student information systems on scheduled teaching.
- Additional supporting information from faculty.
Simple quantitative analysis of faculty activity data allowed the institution to focus on — and reward — programs that were performing well in service of strategic goals. It also identified departments that needed help improving and determined the best ways to go about making those improvements.
The data provided a high-level view of a unit or the university as a whole, enabling Radford to drill down to the class level.
Cosmato explained that with such high-level, institution-wide reporting available, administrators have an easier time determining what’s working. And these evaluations can provide some surprising insights.
“You’d expect to see a lot of service learning opportunities in the social work department, but why was there so much happening in the English department?” he said. “What makes it surprisingly valuable in one place may also apply elsewhere. The Provost can come to you and say, ‘You have some rockstar performers. Let’s get them to share what they know.’”
Radford now plans to use faculty activity data to identify programs excelling in innovations in the classroom, summarized by college, department, or individual. The best ways of showing faculty influence on student success include focusing on both the immediate, day-to-day instructor activities at your institution and the broader vision for improving educational experiences for students.
The impact of faculty activity data
Faculty activity data is powerful, especially when used in conjunction with other campus data. This combination provides a comprehensive view of institutional effectiveness in various areas, including student success.
This data can have profound impacts on your students and their pursuit of academic goals. Faculty insights allow for more tailored support and data-driven curriculum development. Harnessing them to support student-centered teaching and learning initiatives can directly enhance the educational experience for learners at your institution.
Cosmato explained that Radford’s tightly regulated roles and responsibilities system helps provide a strong record of how the university uses its data as well as the questions administrators are asking.
“This speaks to buy-in on the value of this data across the university,” Cosmato said.
Wiech noted that the system’s centralized database enabled Radford to take a more comprehensive view of the institution.
“The university can surface the stories of effectiveness for departments, colleges, and the whole campus,” Wiech said. “And it can evaluate the impact of faculty’s practices on strategic targets such as student success.”
However, your institution needs the right data solutions to measure and assess your faculty’s impact on student success with the greatest accuracy.
Get the most from faculty data with Watermark Faculty Success
Based on Radford’s achievements, it’s clear how faculty influence student success. That’s why we created Watermark Faculty Success — to help higher education institutions simplify faculty data collection and analysis and improve student outcomes.
Watermark Faculty Success pulls faculty activity data from various sources to create a holistic view of your entire institution. Seamless integration with the rest of the Watermark suite provides easy data access for rapid reporting on demand, so you can get the insights you need when you need them. Automated web profile updates ensure prospective students, academic peers, and other visitors get the most current picture of your faculty.
Request a free demo today to see how Watermark Faculty Success can power valuable insights for your institution. We’ll answer any questions you have and provide helpful recommendations for managing implementation, getting faculty buy-in, and more.